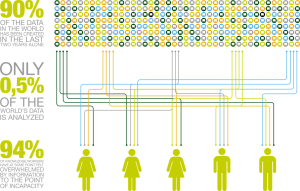
On the surface, a simple “Yes” or “No” question – are you getting what you need from your data? It’s a question every organization’s leadership should be asking themselves. And asking the question brings to light the fact that there are several layers that make the question anything but simple…
First qualifier – what data are we talking about? In the nonprofit arena, discussions around data are often limited to three general areas of operations – program, philanthropy and finance. On the program side, data typically falls into two big buckets – outputs, like how many people were served or how many units of service were delivered, and outcomes, targeting degrees of improvement. Donor data concentrates on categorizing donors, assessing capacity for giving and stewarding relationships through systematic touch points. Financial data is most commonly presented as financial statements, and possibly some budget comparatives. Some organizations might track certain trends and ratios as well. There is a whole other world of data that 1) goes beyond these two core sources and 2) derives from these sources to yield economic insights. Organizations of 50 or more employees might analyze trends in workforce management that impact their overall culture. Understanding how long it takes to fill and on-board a position, and what length of employment experiences the greatest turnover provides valuable insight that can assist in mitigating challenges. Similar information related to maintenance and custodial services and IT services can be captured as well.
Second qualifier – do we currently have this data in a usable and accessible format, and if not what is the cost/benefit trade-off of capturing and analyzing it? Typically, the issue isn’t having the data – it’s having it readily available and usable. It is not unusual for there to be a paradox associated with this question. Sometimes data is readily available, and the organization doesn’t recognize the potential for accessing or using it. Sometimes the data is “analog” and the agency struggles to convert it to a digital format (how’s that paperless office idea working out for you?). And sometimes the data isn’t routinely and consistently warehoused, making analysis challenging if not impossible. This qualifier generally requires a focused commitment at a cross-functional level, reminiscent of a strategic planning process but very narrowly concentrated with respect to data – its capture, storage and ultimate use.
Third qualifier – what will we do with the data we have? Once you’ve defined your data pool and assessed the quality and accessibility of that data, you need to determine how you’re going to use it. There are basic elements that should be defined – how often will it be compiled, in what format, who will it be distributed to and who is responsible for reviewing and acting on the findings. Recent trends in data also emphasize the importance of presentation in visual formats – literally described as data visualization. It should be apparent that there is a little bit of a “chicken and egg” dilemma built into the process, in that at a certain level you should “Begin with the end in mind.” Considering the challenges of understanding data holistically, the process typically unfolds switching back and forth between the end result and the unfolding, shared understanding of the capacity presently available within the data structures and systems currently in place.
Our transition to a “knowledge economy” is commonly accepted, and organizations have adapted by investing in systems and training. With this infrastructure now more fully understood and mature, the next phase – still in its infancy – is how best to leverage information to truly distill knowledge from it. By convening internal stakeholders to strategically plan for data capture, delivery, presentation and analysis, nonprofits can dramatically enhance their mission impact and elevate their workforce.

